Verify it worked
A step-by-step guide to confirming your events landed in the Obsivara dashboard.
Step 1 — Send a test event
If you haven't already, send a quick test event to confirm your API key and connection are working:
curl -X POST https://api.obsivara.com/ingest/webhook/generic \
  -H "Authorization: Bearer obs_live_YOUR_KEY" \
  -H "Content-Type: application/json" \
  -d '{
    "event": "run_finished",
    "run_id": "verify-run-1",
    "asset_id": "my-agent",
    "outcome": "success",
    "duration_ms": 500
  }'
You should receive HTTP 202 with:
{ "source": "generic", "accepted": 1, "rejected": 0, "errors": [] }If you get a 401 or 403, see Errors & troubleshooting to fix the key or scope.
accepted: 1 and rejected: 0 means your event was accepted by the ingest API. It will appear in the dashboard within about one minute.Step 2 — Open the dashboard
Go to app.obsivara.com and log in to your workspace.
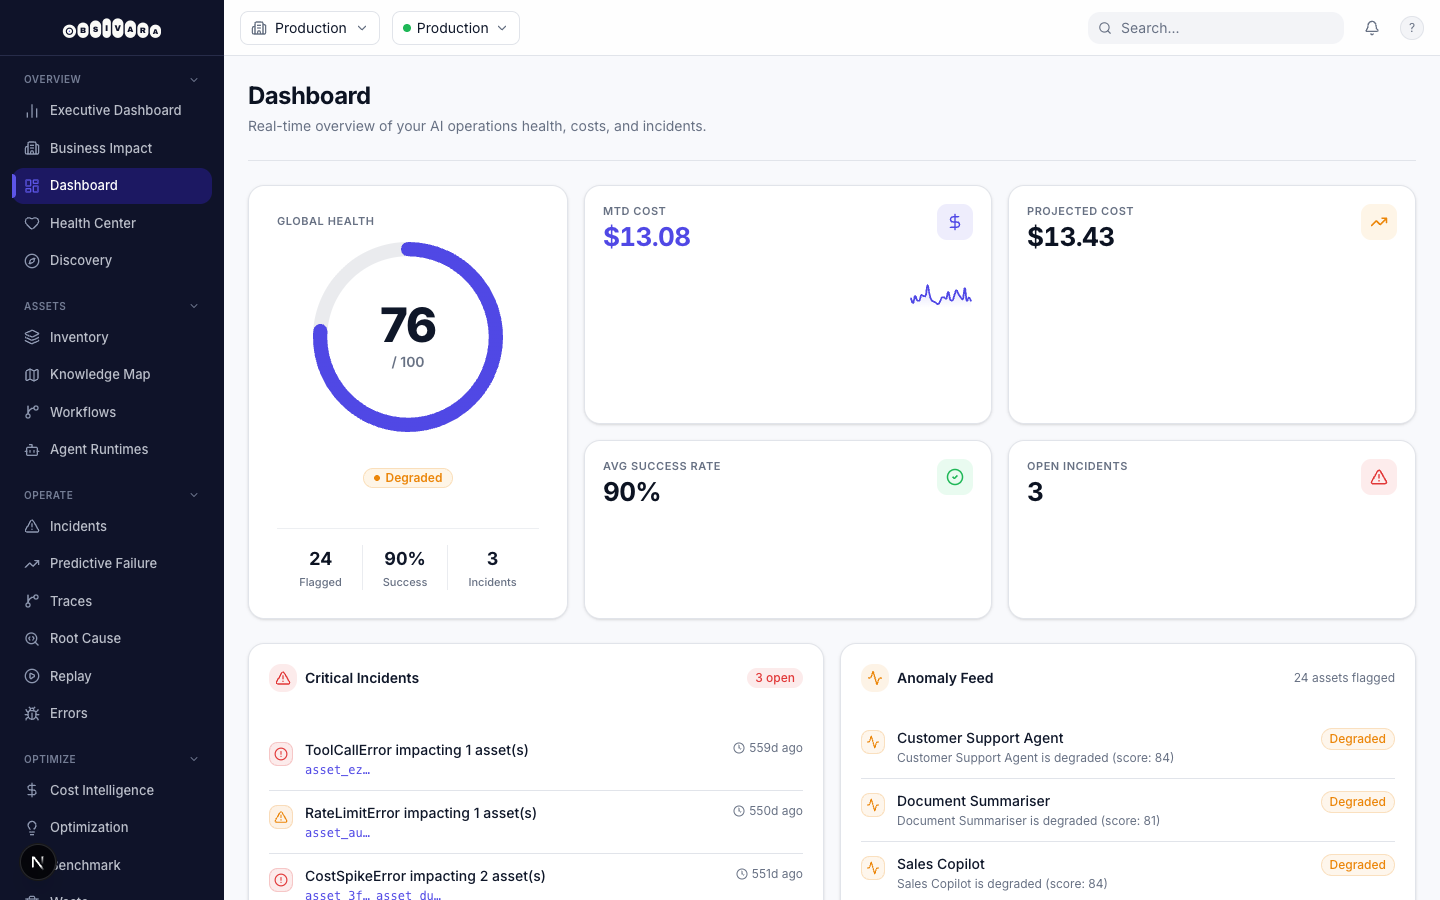
Step 3 — Find your asset
On the main dashboard (inventory/health page), look for the asset_id you sent in your event — for example my-agent. Click it to open the asset detail view.
If the asset does not appear immediately, wait one minute and refresh. New assets can take up to one minute to be indexed.
Step 4 — Inspect the run
Click into a run to see the full trace: spans, LLM calls with token and cost breakdowns, tool calls, and any errors recorded during the run.
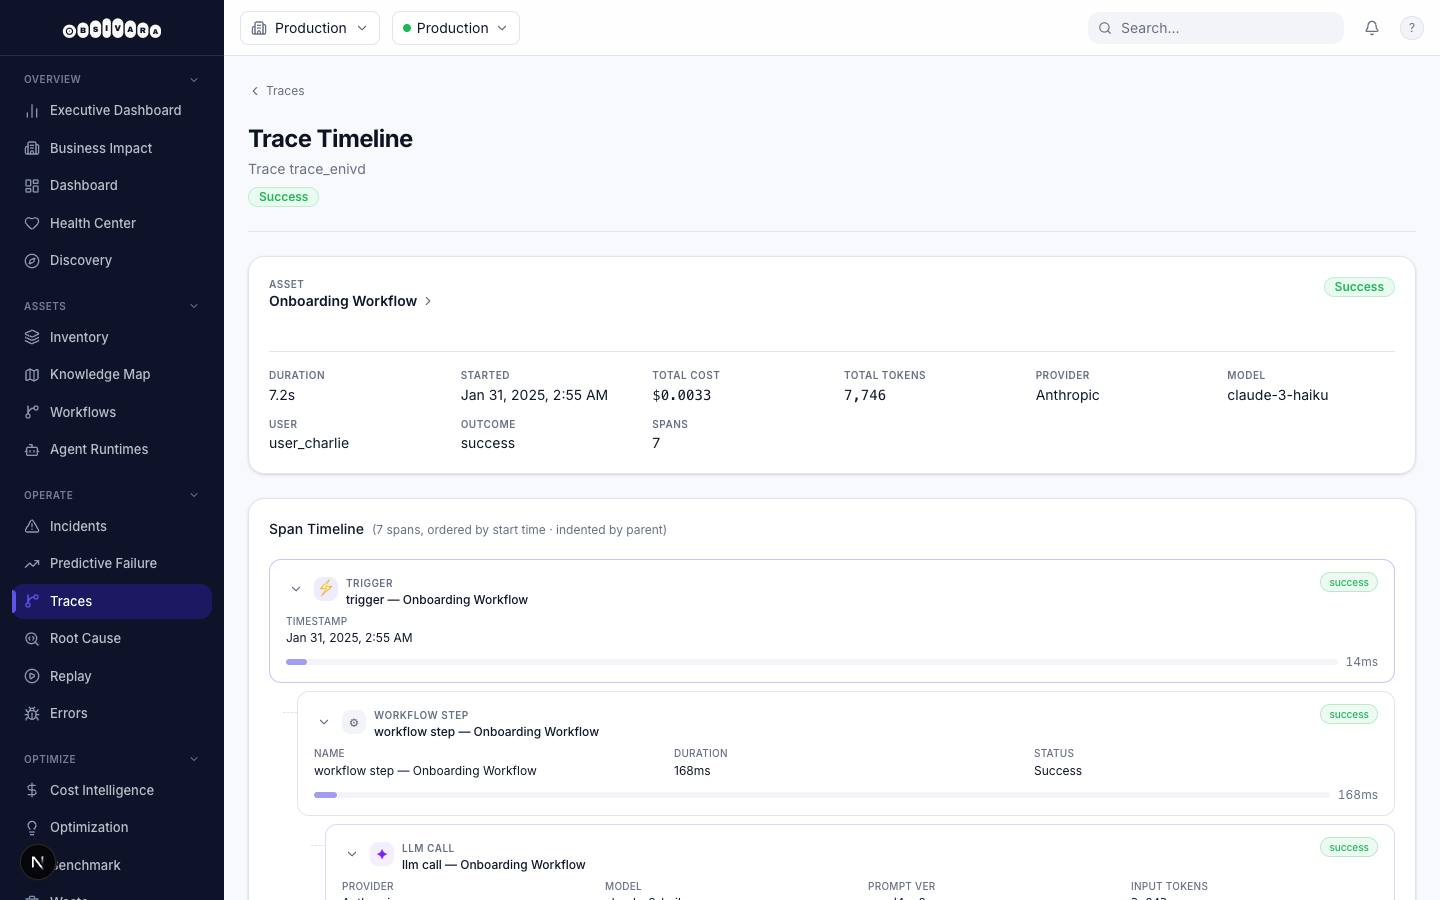
What to check
- Run status: The run should show as
success(or whatever status you sent). If it showserror, check your event'soutcomefield. - Token + cost data: If you sent
llm_callevents (or are using the batch endpoint), the run detail should show token counts and cost per call. This data is not available from n8n sync — only from direct instrumentation. - Spans: If you used
spanevents or OTLP, the trace view will show a waterfall of spans. - Errors: Any
errorevents will appear in the Errors tab of the asset view.
Troubleshooting
If the run is not visible after two minutes:
- Re-check the 202 response — confirm
acceptedis greater than zero andrejectedis zero. - Verify the
asset_idin your event matches what you are searching for in the dashboard (case-sensitive). - Check that your API key is associated with the correct workspace — a key from workspace A will not write to workspace B.
- See Errors & troubleshooting for a full error reference.
Next steps
Once your first event is confirmed, you can:
- Send the full run lifecycle (
run_started→llm_call→run_finished) for richer trace data — see Connect your AI agent. - Use the
/ingest/batchendpoint to send multiple events per request for efficiency — see Event schema. - Forward runs from n8n, LangSmith, or Langfuse — see the Connect section.